
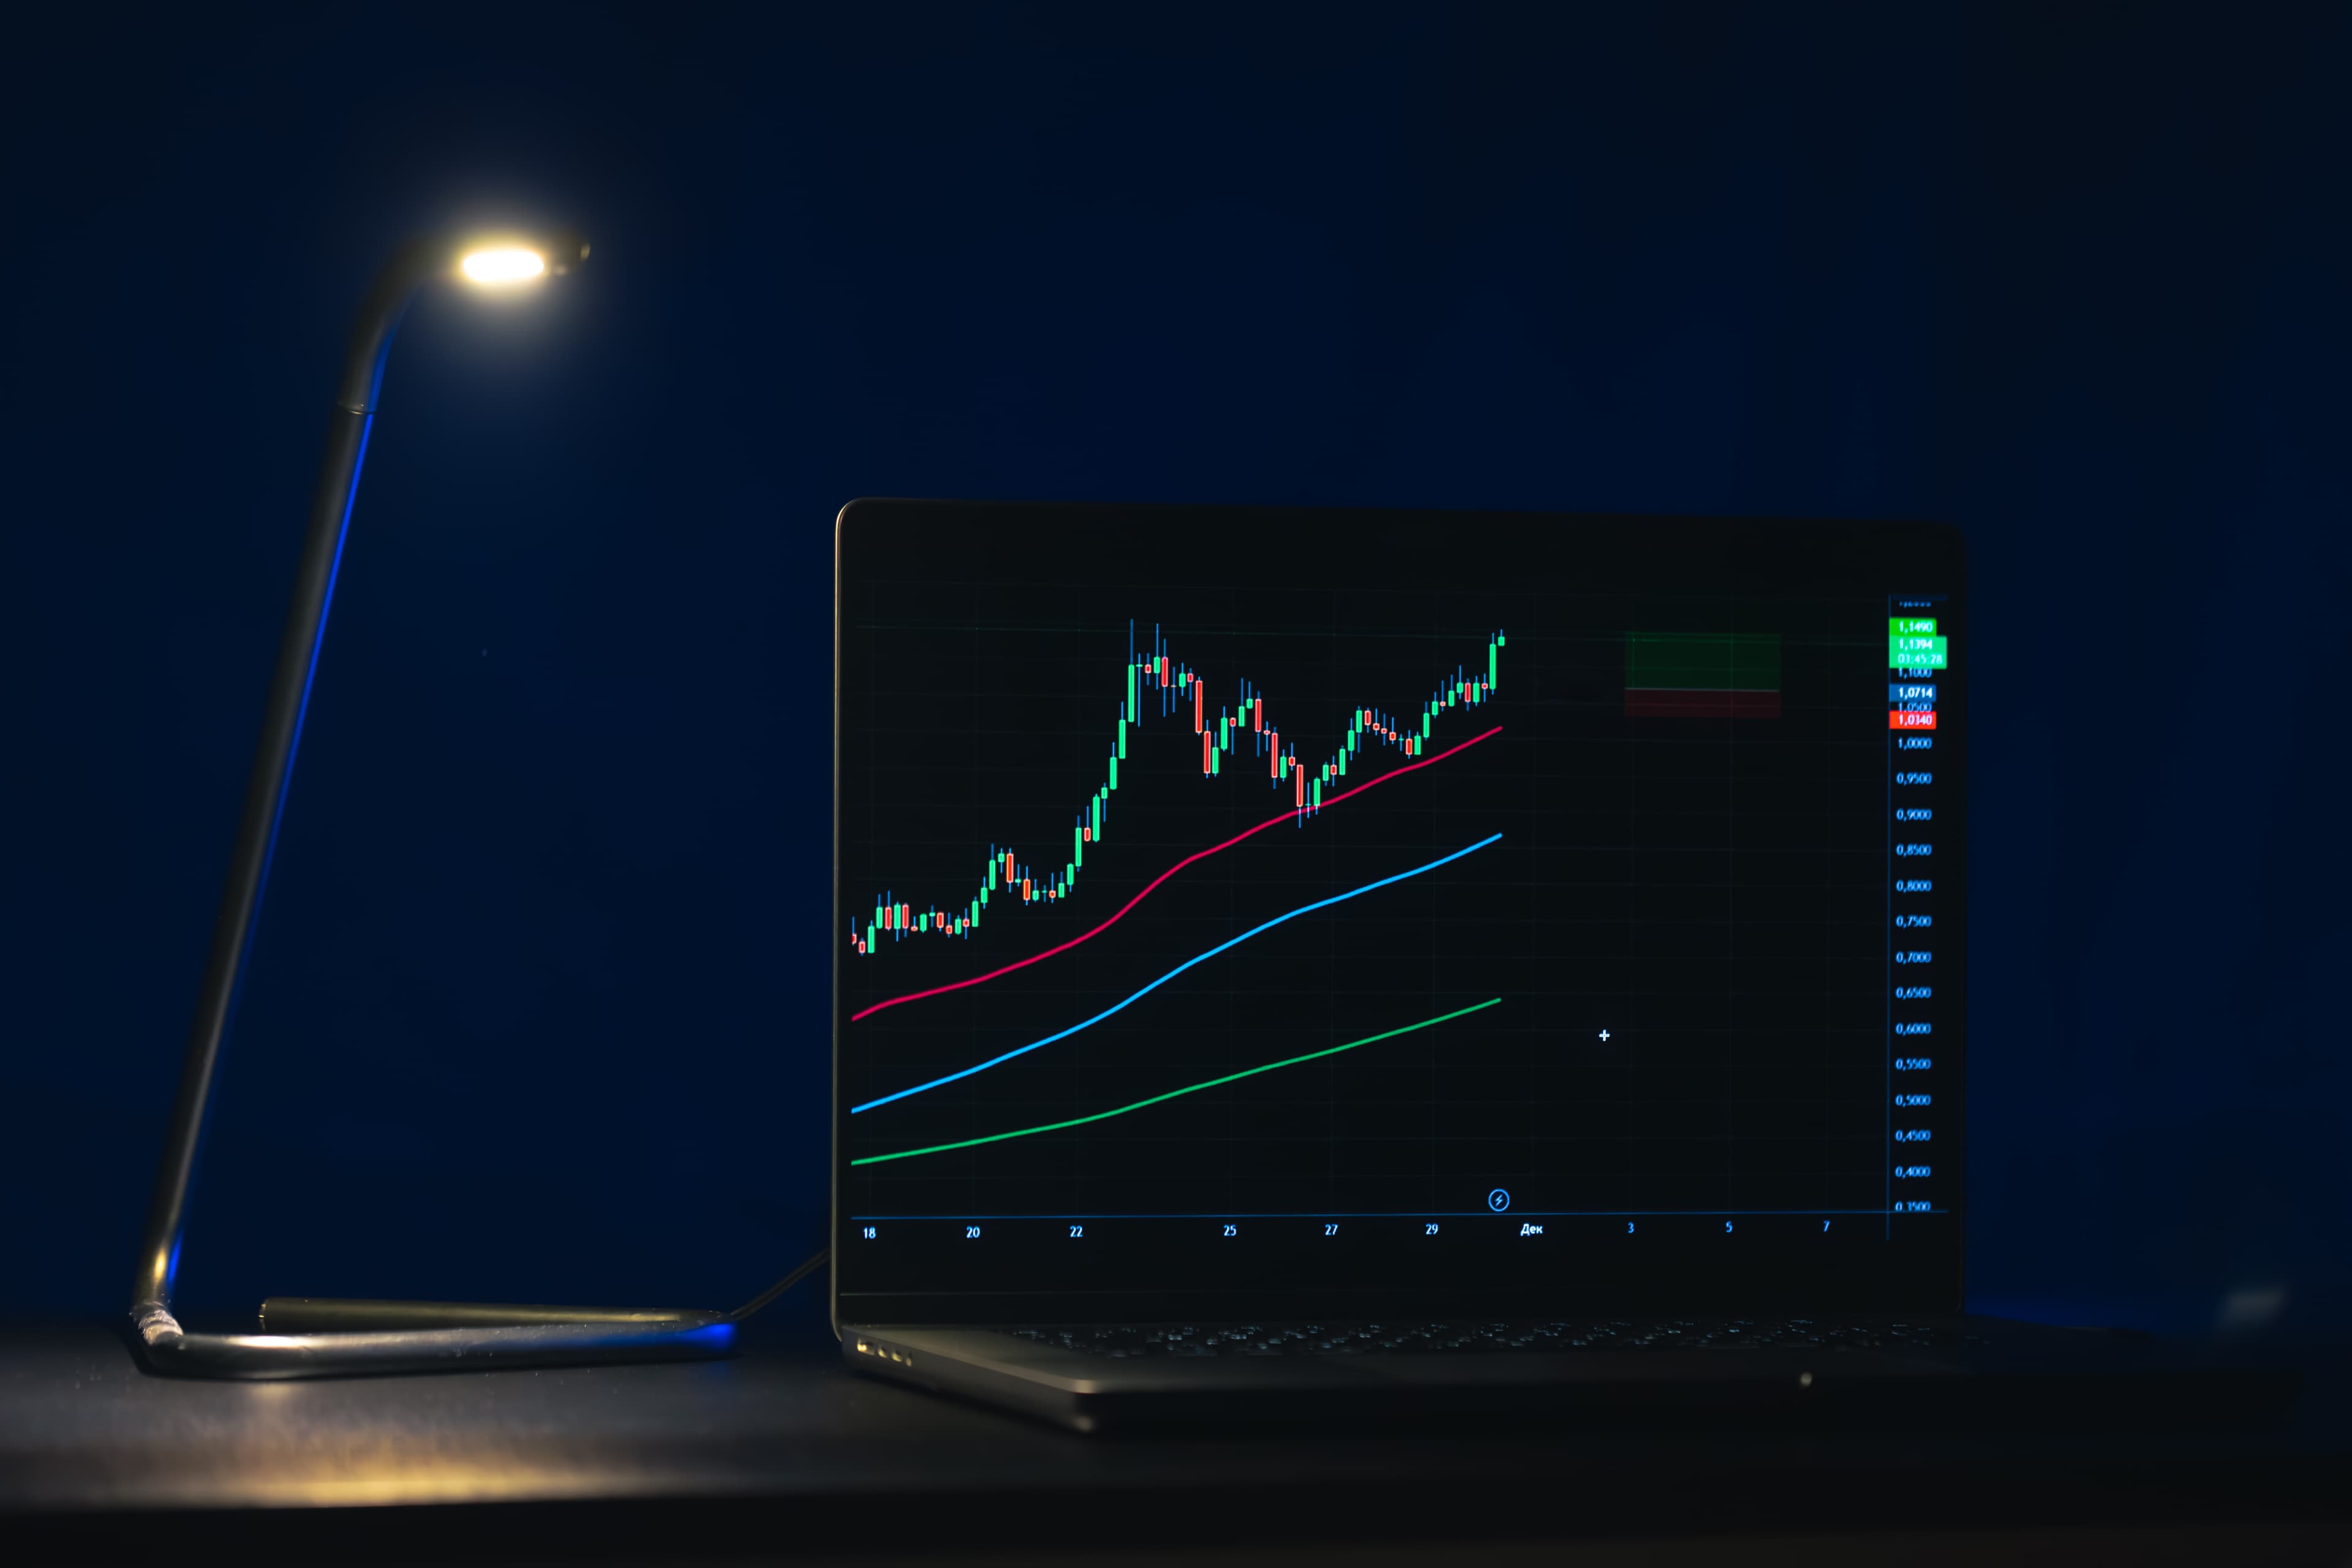
The Unique Volatility Profile of Spot Gold
Spot Gold (XAU/USD) behaves distinctly from traditional forex currency pairs. As a hard commodity, safe-haven asset, and inflation hedge, it reacts intensely to geopolitical escalations, US Treasury yield real rates, and central bank physical reserve accumulation.
Because liquidity is deep, institutional market makers routinely run stops on retail breakout traders near key psychological levels (e.g. $2,700.00, $2,750.00).
Spotting Volume Exhaustion & Liquidity Traps
A Volume Climax occurs when price surges into a key resistance zone accompanied by an exponential spike in tick volume, yet closes with a narrow spread or an extended upper wick (Shooting Star / Pin Bar).
Diagnostic Signs of a Gold Liquidity Trap:
- The Breakout Candle: Strong bullish candle pushing beyond a multi-day high.
- Volume Anomaly: 3x above average 20-period relative volume (RVOL).
- The Immediate Rejection: The following candle completely engulfs the breakout candle within 15 minutes.
- Failed Delta: High volume accompanied by rapid delta divergence (heavy buying absorbed by institutional passive limit orders).
Key Trading Sessions for Gold
| Session | Time (UTC) | Volatility Profile | Strategy Bias |
|---|---|---|---|
| Asian Session | 00:00 - 08:00 | Low to Moderate | Range trading & accumulation |
| London Open | 07:00 - 10:00 | High Expansion | Initial liquidity sweep & trend launch |
| NY/London Overlap | 12:30 - 16:30 | Peak Volume | Main impulsive trends & reversal traps |
| NY Afternoon | 16:30 - 21:00 | Moderate to Low | Continuation & profit taking |
Strategic Takeaways for Gold Traders
- Never Chase Parabolic Moves: If Gold advances more than $30 in an hour without a pullback, wait for the 50% Mean Threshold retracement.
- Watch Real Yields: When the US 10-Year TIPS yield falls, Gold experiences sustained tailwinds.
- Respect Psychological Levels: Round numbers ending in 00 or 50 are prime hunting grounds for liquidity sweeps.